


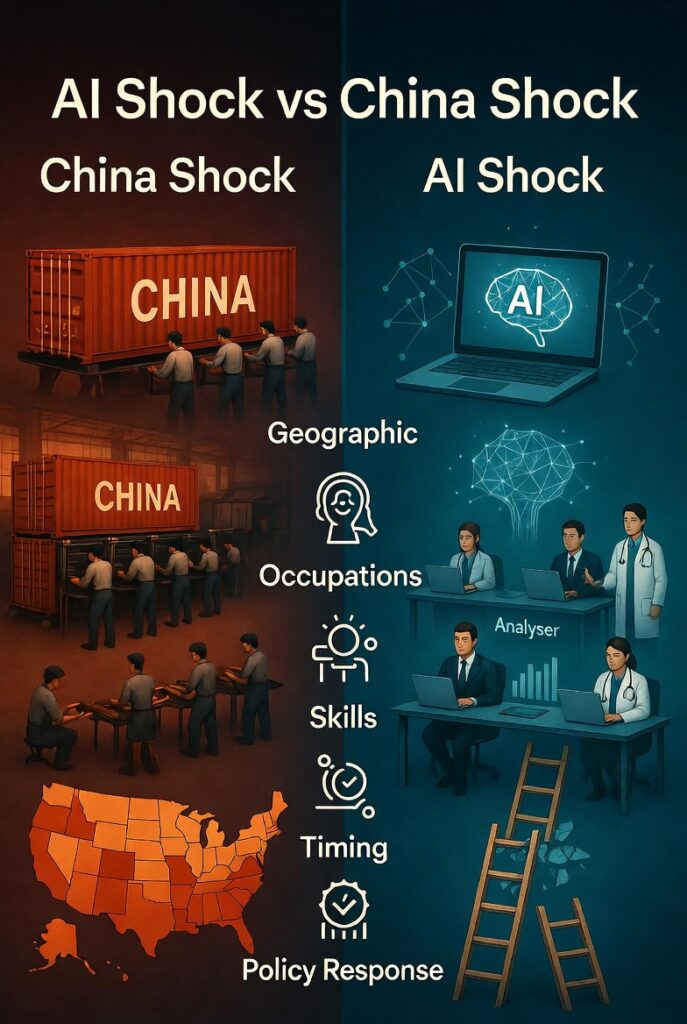

‘The Gains Will Be Substantial’ — The AI Shock Is Looking a Lot Like the China Shock
Apollo’s chief economist says history is on AI’s side. MIT’s David Autor says the analogy misleads as much as it illuminates. Here’s what the data actually shows — and what each side gets right.
- What the AI Shock–China Shock Parallel Actually Means
- The Optimist Case: Where Slok Gets It Right
- The Real 3-Phase Framework
- Where the Analogy Breaks Down
- What 2026 Data Is Already Showing
- Three Mistakes Destroying Your Analysis
- Strategies and Case Studies That Work Now
- Tools and Sources Worth Trusting
- 6-Week Analytical Playbook
- Frequently Asked Questions
Most economists comparing the AI shock to the China shock stop at the headline parallel and declare victory. That is a mistake — and understanding precisely why will tell you more about where this disruption is heading than anything else published on the subject right now.
Apollo Global Management’s chief economist Torsten Slok made the comparison explicit in a May 2026 blog post: AI is following “the same playbook” as the China shock. The displacement force is different — cognitive work this time, not factory floors — but the structural pattern is “remarkably familiar.” His conclusion: if history is any guide, the gains will be substantial.
He may be right at the aggregate level. He is also telling half the story. The China shock’s most consequential finding is not that jobs were lost. It is that those losses were geographically concentrated, occupationally specific, and permanently persistent — invisible in national unemployment statistics for years while actively devastating specific communities.
That is the frame this analysis builds from. Not optimism, not pessimism — specificity. Both Slok and MIT’s David Autor, who coined the term “China shock,” are right about different dimensions of the same disruption. The value is in knowing which dimension each argument addresses.
What the AI Shock–China Shock Parallel Actually Means
The China shock is the documented surge in U.S. import competition following China’s 2001 WTO entry — a disruption that MIT economists David Autor, David Dorn, and Gordon Hanson showed was responsible for 59.3% of all U.S. manufacturing job losses between 2001 and 2019, roughly 4 million positions. The AI shock describes the structural disruption now underway — targeting cognitive and white-collar tasks rather than factory floors.
The practitioner version of the China shock, grounded in Autor et al.’s actual empirical findings, differs from the textbook: aggregate net positive outcomes are entirely consistent with permanent, concentrated devastation in specific communities. Their 2021 follow-up paper found that the hardest-hit U.S. commuting zones still showed depressed employment and income nearly two decades after the initial disruption. The economy adjusted nationally. Those communities did not.
Key data point: Despite a national net positive outcome from the China shock, 6.3% of the U.S. population — 82 of 722 commuting zones analyzed — still experienced absolute declines in real income, even after accounting for lower consumer prices from cheap Chinese goods.
Source: Autor, Dorn & Hanson, NBER Working Paper 29401 (2021)
The central argument of this analysis: headline unemployment figures will very likely stay low during the AI shock. That will not mean everyone is fine. The question is not whether the aggregate outcome is positive — it almost certainly will be. The question is who bears the adjustment cost, for how long, and whether the policy architecture exists to manage the distribution.
The Optimist Case: Where Slok Gets It Right
Slok’s argument deserves genuine engagement, not reflexive “yes, but.” His core evidence is compelling:
The BEA data shows a 50% increase in real U.S. manufacturing value added from 2001 to 2024 — even as manufacturing employment fell sharply. Cheap Chinese inputs did not just destroy jobs: they generated productivity gains that expanded the overall pie. Slok argues AI is doing the same thing right now, and the early business formation data supports this view.
His strongest evidence is the Jevons Paradox applied to labor markets. Economist William Stanley Jevons observed in 1865 that the more efficient Watt steam engine actually increased total coal consumption — because cheaper energy expanded its uses. Applied to AI: as automation makes white-collar work more efficient, the market for those services expands, creating more positions rather than fewer.
The clearest real-world confirmation: AI has automated significant portions of radiology imaging analysis. Yet the number of active radiologists in the U.S. has grown by approximately 10% over the past decade. Lower cost per scan expanded the market for radiology services more than automation reduced the need for radiologists.
Radiology
AI automates imaging analysis. Market for radiology services expands. Net result: ~10% more radiologists despite automation.
Senior legal counsel
AI handles research and drafting. Senior attorneys serve more clients per hour. Expanded scope partially offsets junior compression.
Legal document review
AI fully substitutes for the task. Associate hours on due diligence fall 60–80%. No equivalent market expansion absorbs the loss.
Junior software devs (22–25)
AI generates boilerplate code. Entry-level hiring falls ~20% since late 2022 per Stanford ADP data. Senior employment: stable or rising.
The condition under which Jevons applies is specific: demand for the underlying service must be elastic, AI must augment rather than fully substitute for human judgment, and the profession must span multiple task types so automating routine work frees capacity for higher-value work. Where those conditions hold, the optimists are right. Where they don’t, the structural disruption argument dominates.
Where Slok is right
- Aggregate productivity gains are real and accelerating
- Business formation is rising — absorptive employment is being created
- Jevons expansion demonstrable in augmentation-friendly professions
- Historical precedent supports eventual reabsorption
Where Autor adds caution
- Entry-level career ladders are being compressed now
- AI disrupts functions, not industries — harder to attribute, track, respond to
- China shock adjustment “didn’t happen” for most exposed workers
- Policy window is open now; historically it closes before the crisis peaks
How the AI Shock Actually Works: The Real 3-Phase Framework
Phase 1 — Identify Who Bears the Cost (Not Just How Much Is Lost)
The most common analytical failure is treating displacement as an aggregate figure and stopping there. In the China shock, the critical variables were not total job losses — they were which workers, in which occupations, in which geographic locations, with what labor market alternatives available.
Autor et al.’s 2021 research found that manufacturing job losses in the most exposed communities converted nearly one-for-one into long-term unemployment, not retraining and reemployment. The adjustment that economists predicted — mobile workers flowing to growing sectors — did not happen for the most exposed workers.
The AI shock equivalent: Which specific occupational task clusters are being compressed? Do those task clusters represent the entry-level career-ladder rungs that serve as professional on-ramps? Do affected workers have viable alternative pathways nearby?
Phase 2 — Map Augmentation vs. Substitution (The Jevons Test)
Phase 2 is where Slok’s optimism has genuine force — and where the empirical work must be done occupation by task cluster, not in aggregate. The Jevons paradox operates under specific, testable conditions (see grid above). Apply those conditions to the specific occupational categories in your analysis before accepting either the optimistic or pessimistic conclusion.
The radiology case is not a universal law. It is a conditional result. The condition is augmentation-dominant AI impact with elastic downstream demand. Test for it; do not assume it.
Phase 3 — Track the Policy Gap Before It Becomes a Political Crisis
The China shock’s 20-year persistence is the most important long-run data point. Trade Adjustment Assistance programs were documented by Autor et al. as far too small and too late to produce meaningful impact. Congress eventually failed to reapprove even that underfunded program. BlackRock CEO Larry Fink warned in his 2026 shareholder letter of the “real risk” that AI widens wealth inequality, with rewards concentrated among insiders. Former policymakers and economists are now drafting fiscal architecture specifically to avoid repeating that failure.
The window is open. The China shock evidence suggests it will close before anyone expects it to.
Where the AI Shock–China Shock Analogy Breaks Down
MIT’s David Autor is explicit: AI “will not be, in any sense, a repeat of the China trade shock.” Not because it will be gentler, but because it is structurally different in ways that change both the disruption pattern and the recovery mechanism.
“The China trade shock was experienced by U.S. firms as a pure negative competitive shock. All of a sudden, they couldn’t charge the prices they were charging. AI will be experienced by many firms as productivity increases — so it may still lead to displacement of workers. But it will have a very different texture.” — David Autor, MIT, Possible podcast, May 2026
This distinction matters for attribution and political response. The China shock created identifiable cause and effect — imported goods, specific firms closing, specific towns emptying. AI displacement will appear in company books as productivity gain, making it far harder to identify, attribute, and politically organize around.
| Dimension | China Shock (2001–2019) | AI Shock (2023–present) |
|---|---|---|
| Primary target | Manufacturing, physical labor | Cognitive, white-collar tasks |
| Geographic concentration | High — specific regional clusters | Low — diffuse across metros |
| Workers displaced | Predominantly non-college | Predominantly college-educated, early-career |
| Displacement mechanism | Competitive price pressure on firms | Productivity substitution within firms |
| Firm-level experience | Pure competitive threat (negative) | Productivity gain (positive) |
| Political attribution | Clear — imports, trade policy | Obscured — internal efficiency gains |
| Headline unemployment | Masked — stable nationally | Likely masked — stable nationally |
| Adjustment pathway needed | Regional mobility (didn’t happen) | Occupational reskilling (still unproven) |
| Jevons paradox applicability | N/A | Strong in augmentation roles; weak in full-substitution roles |
| Policy window | Missed — response came after devastation | Currently open — architecture being drafted |
What the 2026 Data Is Already Showing
The abstract debate resolves when you look at the actual numbers. Three datasets are providing early-warning signals now — the kind that appeared in manufacturing employment data three to four years before the China shock’s full impact became visible in aggregate statistics.
Signal 1: The Stanford ADP Study
The most methodologically rigorous early-stage evidence comes from Stanford Digital Economy Lab researchers Erik Brynjolfsson, Bharat Chandar, and Ruyu Chen, whose August 2025 working paper “Canaries in the Coal Mine?” used high-frequency payroll data from ADP — the largest U.S. payroll provider, covering millions of workers — to identify six empirical facts about AI’s current labor market effects.
The canary signal: Employment of 22–25 year-old software developers has fallen approximately 20% since late 2022. Employment for developers over 35 in the same field: unchanged or rising. The 13% figure covers AI-exposed occupations broadly; software development shows the sharpest early decline.
Source: Brynjolfsson, Chandar & Chen, Stanford Digital Economy Lab, August 2025
Critical methodological note: these declines persist after controlling for firm-level economic shocks — meaning this is not explained by tech-sector hiring freezes or post-pandemic normalization alone. The pattern is AI-exposure specific.
Signal 2: Anthropic’s March 2026 Labor Market Report
Anthropic’s March 2026 internal research reached a carefully calibrated conclusion: job-finding rates for young workers entering AI-exposed occupations have fallen by approximately 14% relative to 2022, while the unemployment rate itself remains flat. This is the hiring-slowdown-before-layoffs pattern that characterizes the early phase of structural labor market shifts. Workers are not being fired. They are not being hired to replace those who leave.
Signal 3: Business Formation — Slok’s Leading Indicator
The BEA data shows a 50% increase in real U.S. manufacturing value added from 2001 to 2024 despite employment falling — proof that productivity gains from cheap inputs can generate real economic expansion. Tracking current business formation rates is the fastest way to assess whether AI is generating equivalent absorptive employment or whether productivity gains are staying inside existing firms. Rising formation supports the optimistic scenario. Flat or declining formation means Jevons expansion is not yet operating at meaningful scale.
| Signal | China Shock (2001–2004) | AI Shock (2023–2026) |
|---|---|---|
| National unemployment | Stable | Stable |
| Young worker employment in exposed roles | Declining in manufacturing regions | −13–20% in AI-exposed occupations (ages 22–25) |
| Hiring rates in exposed roles | Declining — fewer new entrants | −14% job-finding rate for young exposed workers |
| Senior worker employment (same occupations) | Stable | Stable or rising |
| Aggregate productivity | Rising | Rising |
| Policy response | Lagging — TAA underfunded | Pre-emptive — architecture being drafted |
Three Mistakes Quietly Destroying Your AI Shock Analysis
The root cause is a mental model inherited from macroeconomics that treats labor as a fluid, mobile factor. Autor et al.’s research demolished this assumption empirically: workers do not freely relocate or reskill when their specific job disappears. In the China shock, exit from work — not retraining and reemployment — was the primary adjustment mechanism for the most exposed workers. Commuting zones that lost manufacturing jobs did not gain equivalent service sector jobs; they gained disability claimants and early retirees.
Treating stable headline unemployment as evidence against displacement is the precise analytical mistake the China shock literature spent a decade correcting. The Yale Budget Lab found little evidence of mass AI displacement in aggregate labor market statistics — a finding Slok cites approvingly. That finding is consistent with both the optimistic and the devastating scenarios.
A law firm deploying AI document review tools reports productivity gains; the paralegal cohort that would have been hired to do that work simply does not get hired. This displacement is invisible in the firm’s own employment statistics — headcount is stable, productivity is up — but it is visible in aggregate entry-level legal hiring data. The China shock’s worst documentation failure was exactly this: firms in non-exposed sectors reported positive outcomes nationally, masking devastation in exposed regional labor markets.
Popular counter-evidence that fails here: the frequent claim that “AI creates more jobs than it destroys” is true at the macro level and demonstrably false for the specific workers most exposed. The resolution depends entirely on which question you are asking and at what level of resolution.
Autor’s clearest 2026 contribution: AI disrupts functions, not firms or sectors. A senior partner at a law firm and a first-year associate have identical occupation-level AI exposure (both are “lawyers”). Their task-level exposure is radically different — document review and legal research are highly automatable; client relationship management and courtroom judgment are not. Industry-level analysis will systematically understate disruption in any heterogeneous profession.
The career-ladder implication: the entry point into the legal profession is being compressed, without the partner role being affected. This creates a structural gap in how the next generation of partners will be trained — a problem that does not appear in occupation-level data for years, but compounds across 5–10 years in the background.
Strategies and Case Studies That Work Right Now
The Underused Approach: Task-Level Exposure Mapping
The single most underused framework in this debate — and the one with the strongest predictive record from the China shock literature — is task-level exposure mapping rather than occupation- or industry-level analysis. The O*NET task database, cross-referenced with Acemoglu’s 2024 NBER working paper (WP 32487) on AI exposure scores, provides the methodological foundation. It is publicly available. Almost no practitioner-level analysis applies it correctly.
Here is what task-level analysis reveals that occupation-level misses: a senior partner at a law firm and a first-year associate have identical occupation-level AI exposure (both are “lawyers”). Their task-level exposure is radically different. The correct analysis disaggregates the task mix within the occupation, not just the occupation label.
Case Study 1: Legal Document Review — The Before/After That Changes How You Think About This
Firms that deployed AI document review tools reported reducing associate hours on due diligence by 60–80% within 18 months of adoption. In the short run, those firms did not reduce headcount — they redirected associate time to higher-judgment tasks and expanded client capacity. This is the Jevons effect working as Slok describes.
The three-year question is whether the entry-level pipeline continues to justify its economics. If firms handle 40% more client work with the same number of senior associates because AI absorbed the document review load, the rational hiring decision is to staff fewer first-year positions. The senior associates who exist today were trained through document review. Where do the senior associates of 2032 come from? This is a structural concern invisible in current unemployment statistics that compounds over time.
Read our deeper analysis of AI career ladder compression — how it compounds and what early signals to track.
Case Study 2: Radiology — The Jevons Effect Working at Scale
AI has automated significant portions of medical imaging analysis. By most measures, AI tools can now match radiologist accuracy on specific diagnostic tasks. Standard economic prediction: fewer radiologists needed. What actually happened: the number of active radiologists in the U.S. grew by approximately 10% over the past decade.
The mechanism: lower cost per scan expanded the market for radiology services — more scans ordered, more conditions detected early, more specialist consultations generated. The productivity gain expanded demand more than it reduced headcount. This is precisely what Slok’s Jevons argument predicts, and radiology demonstrates it at scale. The key enabling condition: demand for the underlying service (diagnostic imaging) is highly elastic, and the physician’s judgment layer remains central to clinical decision-making.
Case Study 3: Early-Career Software Development — The Counter-Evidence
The Brynjolfsson et al. Stanford paper identified software development as the sharpest early example of AI-driven entry-level displacement. Employment of 22–25 year-old software developers fell approximately 20% since late 2022, while employment of developers over 35 in the same field remained stable or grew. AI coding tools — GitHub Copilot, Cursor, Claude Code — generate boilerplate code, debug common errors, and handle the repetitive implementation work that historically defined junior developer roles.
The Jevons test applied: demand for software is elastic ✓ — but AI in this case is substituting for the specific tasks that defined the entry-level role ✗, not augmenting a judgment-intensive layer that remains human-centered. The result is Jevons expansion at the senior level (experienced engineers doing more with less support) and structural compression at the entry level (fewer junior positions that provide the training ground for future seniors).
See our tracking of entry-level tech hiring trends for quarterly updates.
The Three Approaches With the Strongest Evidence Base
- Track occupational wage premiums in AI-exposed task clusters. The 13–20% employment decline in AI-exposed early-career workers is visible in BLS data. Wage premium trends for mid-to-senior roles in the same occupations are the next signal: if senior wages are rising while junior employment falls, Jevons is operating. If both are flat, full-substitution dynamics dominate.
- Monitor business formation rates alongside employment rates. Slok’s argument requires AI-driven productivity to generate new businesses and new hiring — not just efficiency gains within existing firms. The Census Bureau’s monthly Business Formation Statistics release is the leading indicator. We track this monthly here.
- Map geographic AI adoption concentration. AI adoption is currently concentrated in coastal, highly-educated metropolitan areas. The question that determines the analogy’s accuracy is whether displaced occupational cohorts have accessible alternative roles, or whether specific cities or professions develop the AI-shock equivalent of the Appalachian furniture town — a community with concentrated loss and no absorptive alternatives.
| Occupation / Task Cluster | AI Impact Type | Jevons Strength | Current Evidence |
|---|---|---|---|
| Radiology | Augmentation of imaging analysis | Strong ✓ | ~10% growth in active radiologists despite AI adoption |
| Legal — senior counsel | Augmentation of judgment work | Moderate ✓ | Expanded client capacity per attorney; hiring stable |
| Legal — document review | Substitution of routine tasks | Weak ✗ | 60–80% reduction in associate hours on due diligence |
| Software dev — senior (35+) | Augmentation of architecture & judgment | Moderate ✓ | Employment stable or rising (Stanford ADP data) |
| Software dev — junior (22–25) | Substitution of boilerplate coding | Weak ✗ | ~20% employment decline since late 2022 |
| Financial analysis — entry | Substitution of modeling & reporting | Weak ✗ | First-draft forecasts, variance analysis automated |
| Management consulting — senior | Augmentation of synthesis & client work | Moderate ✓ | Productivity gains reinvested in expanded engagements |
| Customer support — tier 1 | Full substitution | Negligible ✗ | Broad chatbot deployment; first-level inquiry automation |
Tools and Sources Worth Trusting — And What to Avoid
Essential Primary Sources (All Free)
O*NET Online
Task-level occupational data — the correct unit of analysis for AI exposure mapping per Autor’s framework. Cross-reference with Acemoglu’s AI exposure scores (NBER WP 32487) for quantitative estimates. Most useful for disaggregating automatable vs. judgment-requiring task mixes within a specific occupation.
U.S. Census Business Formation Statistics
Monthly new business application data with a two-month lag. The leading indicator for Slok’s business-formation argument. Rising formation supports the Jevons scenario; flat or declining formation means productivity gains are concentrating inside existing firms without generating absorptive new employment.
BLS Occupational Employment and Wage Statistics
Quarterly wage and employment data by occupation — the dataset where the 13–20% early-career employment decline first became visible. Track wage premiums by career stage within AI-exposed occupations; this is where Jevons expansion either appears or fails to appear in the data.
Brynjolfsson, Chandar & Chen — “Canaries in the Coal Mine?” (Stanford, 2025)
The most methodologically rigorous early-stage empirical evidence available. Uses ADP payroll data covering millions of U.S. workers. Required reading for any serious AI shock analysis. Note: this is a working paper, not yet peer-reviewed — treat findings as strong preliminary evidence, not settled fact.
Autor, Dorn & Hanson — NBER Working Paper 29401 (2021)
The China shock persistence paper — foundational for any analysis of the AI shock analogy. Dense but the findings section is accessible. The section on why labor markets failed to adjust (not just that they did) is the most important part for evaluating the AI parallel.
Apollo Daily Spark — Torsten Slok
Read the primary source rather than media summaries. The May 2026 China shock comparison and April 2026 Jevons paradox posts are the core optimistic-case documents. Slok cites his data sources — trace them. Published weekly with current macro data.
⚠️ Sources With Known Framing Problems
Tech company earnings calls claiming zero AI displacement
These measure the reporting firm’s own employment decisions, not broader labor market effects on workers displaced by AI-augmented productivity gains at other firms or within the firm’s supply chain. Firm-level stability is consistent with sector-level entry-level compression.
“Aggregate unemployment is stable” used as AI displacement counter-evidence
This specific methodological error was the central blind spot of early China shock analysis. Stable aggregate unemployment is completely consistent with severe, concentrated occupational damage. It is necessary but entirely insufficient counter-evidence. The China shock looked identical in aggregate statistics for years.
WEF “170 million new jobs” aggregate figures used as individual reassurance
These figures conflate aggregate job creation with individual transition capacity. The China shock created net new jobs nationally. Rockingham County furniture workers did not experience those net new jobs. Net positive aggregate outcomes do not determine individual outcomes for the most exposed cohorts.
Your 6-Week Analytical Playbook
Whether you are a researcher, a policy analyst, or a professional in an AI-exposed field, the same analytical discipline applies. The following framework is designed to get your analysis operating at the right level of resolution — the level where the AI shock is already visible — within six weeks.
Build your task-level exposure map
Pull the O*NET data for the three to five occupations most relevant to your context. Cross-reference with Acemoglu’s NBER WP 32487 AI exposure scores. Output: a task-level map distinguishing automatable tasks from judgment-requiring tasks within each occupation. If your analysis cannot distinguish between “senior partner” and “first-year associate” AI exposure within the same profession, it is not at the right resolution. Task-level mapping methodology →
Read the China shock persistence paper
Read Autor, Dorn, and Hanson’s 2021 persistence paper (NBER WP 29401), specifically the sections on why labor markets failed to adjust. The three failure mechanisms — geographic concentration, narrow skill sets, absence of alternative employers — are your evaluation checklist for the AI shock’s equivalent exposure patterns. Apply them to your mapped occupational categories before proceeding.
Establish BLS occupational employment baseline
Pull the BLS Occupational Employment and Wage Statistics for AI-exposed categories and establish a quarterly tracking baseline. The 13–20% relative employment decline in AI-exposed early-career workers is the clearest early signal in this data. Your Day 14 output: three task clusters where displacement is measurable right now, and three where Jevons-style expansion appears to be occurring.
Run the geographic concentration test
Map where workers in your tracked occupational categories are located and whether those locations have alternative employment absorption capacity. For the AI shock, the relevant concentration test is occupational rather than geographic: are the entry-level roles being compressed in a profession that spans many firms and cities — or in a single-employer context with no exit pathway?
Pull business formation data
Pull the monthly Census Business Formation Statistics for the most recent six months. Assess whether new business formation is tracking above or below the 2019–2023 baseline in the sectors where your tracked occupational categories are concentrated. Rising formation is Slok’s strongest leading indicator for eventual employment absorption. We track this monthly here →
Apply the three Jevons effect tests
For each occupational task cluster: (1) Are wage premiums for senior roles rising while junior employment falls? (2) Is the firm’s client base expanding — not just headcount staying flat? (3) Is new business formation in the sector rising? Strong Jevons dynamics produce yes to all three. Full-substitution dynamics produce no to all three. Most real occupations will be split — document which tasks fall into each category.
Establish quarterly monitoring cadence
Set up a quarterly tracking cadence using BLS data and Census BFS. The China shock’s early warning signals were visible in the right data three to four years before aggregate statistics reflected the disruption. A monitoring baseline established now, in 2026, produces actionable data on Jevons vs. substitution dynamics by 2028 — before the policy window closes.
The three highest-leverage moves for week 1
- Switch to task-level analysis immediately. Occupation-level and industry-level AI exposure data will tell you almost nothing useful about the AI shock’s trajectory until it is far too late to act on it.
- Read Autor et al. 2021 persistence paper’s findings section — specifically the mechanism analysis of why markets failed to adjust, not just that they did. Apply those mechanisms as a checklist to the AI shock’s equivalent exposure patterns.
- Set up monthly BLS and Census BFS data pulls simultaneously. You need both to distinguish Jevons-style absorption from bare displacement. One without the other gives you an incomplete picture in either direction.
Frequently Asked Questions
Take This Analysis From Abstract to Actionable
The China shock’s most important lesson is not in the aggregate outcome. It is in the mechanism by which early-stage data — visible to anyone checking the right variables — was ignored for years while the policy window closed. Within the next 24 hours, pull the Stanford “Canaries” paper and check the BLS Occupational Employment data for the three occupational categories most relevant to your professional context. If the data doesn’t change how you think about AI’s current labor market effects, you are looking at the wrong variables.
Explore Our AI Labor Market Analysis →The Shocking Future of AI and Human Identity
The Most Controversial Banned AI Patents in 2026
About